本文参考51CTO博客,千峰教育一原文链接贴在前面Python爬取天气数据及可视化分析!_千锋教育的技术博客_51CTO博客
前言:相当于一个练手小demo,因为代码逻辑比较清晰,结构也很易懂。项目通过分步调用函数的方法进行编写,让整个项目看起来都很舒服,清爽,更容易读懂。绘图使用到matplotlib库中的plt.plot()方法,代码中的一些语法和书写格式有做调整(本人使用的python版本为3.8.10)
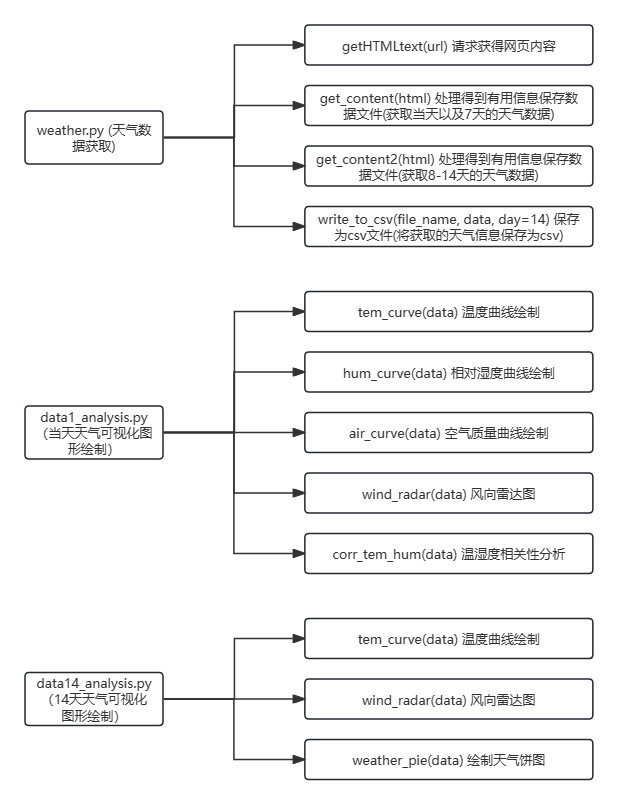
demo框架:
大体分为两部分:1.获取数据 2.绘图
demo结构:
第一个部分:
weather.py(天气数据获取) :
1.通过链接获取当天以及七天的天气网网页数据 -> 2.通过获取的天气数据获取当天以及七天的天气数据->3.通过另外一个链接获取天气网8-15天的网页数据 -> 4.通过获取的天气数据获取8-15天的天气数据 -> 5.将获取的数据分开写入csv文件中存储
部分代码做了调整,在保存时做了文件校验,当文件存在时会先删除原有文件,然后再进行存储,原因是因为再做图形绘制的时候读取csv文件时如果多次存储到同一文件时会导入重复的表头,因为这里只考虑一次分析当天以及后15天的数据未考虑累计的天气数据分析(这里也可以通过需求调整调用的保存方法,判断是否存在原有文件以及表头数据,对重复表头进行去除)
# weather.py
import requests
from bs4 import BeautifulSoup
import csv
import json
import os

def getHTMLtext(url):
"""请求获得网页内容"""
 try:
r = requests.get(url, timeout=30)
r.raise_for_status()
r.encoding = r.apparent_encoding
print("成功访问")
return r.text
except:
print("访问错误")
return " "

def get_content(html):
"""处理得到有用信息保存数据文件"""
 final = [] # 初始化一个列表保存数据
bs = BeautifulSoup(html, "html.parser") # 创建BeautifulSoup对象
body = bs.body
data = body.find('div', {'id': '7d'}) # 找到div标签且id = 7d
# 下面爬取当天的数据
data2 = body.find_all('div', {'class': 'left-div'})
text = data2[2].find('script').string
text = text[text.index('=') + 1:-2] # 移除改var data=将其变为json数据
jd = json.loads(text)
dayone = jd['od']['od2'] # 找到当天的数据
final_day = [] # 存放当天的数据
count = 0
for i in dayone:
temp = []
if count <= 23:
temp.append(i['od21']) # 添加时间
temp.append(i['od22']) # 添加当前时刻温度
temp.append(i['od24']) # 添加当前时刻风力方向
temp.append(i['od25']) # 添加当前时刻风级
temp.append(i['od26']) # 添加当前时刻降水量
temp.append(i['od27']) # 添加当前时刻相对湿度
temp.append(i['od28']) # 添加当前时刻控制质量
# print(temp)
final_day.append(temp)
count = count + 1
# 下面爬取7天的数据
ul = data.find('ul') # 找到所有的ul标签
li = ul.find_all('li') # 找到左右的li标签
i = 0 # 控制爬取的天数
for day in li: # 遍历找到的每一个li
if i < 7 and i > 0:
temp = [] # 临时存放每天的数据
date = day.find('h1').string # 得到日期
date = date[0:date.index('日')] # 取出日期号
temp.append(date)
inf = day.find_all('p') # 找出li下面的p标签,提取第一个p标签的值,即天气
temp.append(inf[0].string)

tem_low = inf[1].find('i').string # 找到最低气温

if inf[1].find('span') is None: # 天气预报可能没有最高气温
tem_high = None
else:
tem_high = inf[1].find('span').string # 找到最高气温
temp.append(tem_low[:-1])
if tem_high[-1] == '℃':
temp.append(tem_high[:-1])
else:
temp.append(tem_high)

wind = inf[2].find_all('span') # 找到风向
for j in wind:
temp.append(j['title'])

wind_scale = inf[2].find('i').string # 找到风级
index1 = wind_scale.index('级')
temp.append(int(wind_scale[index1 - 1:index1]))
final.append(temp)
i = i + 1
return final_day, final
# print(final)

def get_content2(html):
"""处理得到有用信息保存数据文件"""
 final = [] # 初始化一个列表保存数据
bs = BeautifulSoup(html, "html.parser") # 创建BeautifulSoup对象
body = bs.body
data = body.find('div', {'id': '15d'}) # 找到div标签且id = 15d
ul = data.find('ul') # 找到所有的ul标签
li = ul.find_all('li') # 找到左右的li标签
final = []
i = 0 # 控制爬取的天数
for day in li: # 遍历找到的每一个li
if i < 8:
temp = [] # 临时存放每天的数据
date = day.find('span', {'class': 'time'}).string # 得到日期
date = date[date.index('(') + 1:-2] # 取出日期号
temp.append(date)
weather = day.find('span', {'class': 'wea'}).string # 找到天气
temp.append(weather)
tem = day.find('span', {'class': 'tem'}).text # 找到温度
temp.append(tem[tem.index('/') + 1:-1]) # 找到最低气温
temp.append(tem[:tem.index('/') - 1]) # 找到最高气温
wind = day.find('span', {'class': 'wind'}).string # 找到风向
if '转' in wind: # 如果有风向变化
temp.append(wind[:wind.index('转')])
temp.append(wind[wind.index('转') + 1:])
else: # 如果没有风向变化,前后风向一致
temp.append(wind)
temp.append(wind)
wind_scale = day.find('span', {'class': 'wind1'}).string # 找到风级
index1 = wind_scale.index('级')
temp.append(int(wind_scale[index1 - 1:index1]))

final.append(temp)
return final

def write_to_csv(file_name, data, day=14):
"""保存为csv文件"""
 # 在保存文件之前先检查文件是否存在,如果存在,先删除文件再进行保存
if os.path.exists(file_name):
os.remove(file_name)

with open(file_name, 'a', errors='ignore', newline='') as f:
if day == 14:
header = ['日期', '天气', '最低气温', '最高气温', '风向1', '风向2', '风级']
else:
header = ['小时', '温度', '风力方向', '风级', '降水量', '相对湿度', '空气质量']
f_csv = csv.writer(f)
f_csv.writerow(header)
f_csv.writerows(data)

def main():
"""主函数"""
 print("Weather test")
# 珠海
url1 = 'http://www.weather.com.cn/weather/101280701.shtml' # 7天天气中国天气网
url2 = 'http://www.weather.com.cn/weather15d/101280701.shtml' # 8-15天天气中国天气网

html1 = getHTMLtext(url1) # 获取1-7天html页面数据
data1, data1_7 = get_content(html1) # 获得1-7天和当天的数据

html2 = getHTMLtext(url2) # 获取8-15天html页面数据
data8_14 = get_content2(html2) # 获得8-14天数据
data14 = data1_7 + data8_14
# print(data)
write_to_csv('weather14.csv', data14, 14) # 保存为csv文件
write_to_csv('weather1.csv', data1, 1)

if __name__ == '__main__':
main()
第二部分:
data1_analysis.py(当天天气图形绘制)
1.读取天气数据 -> 2.通过读取到的数据绘制温度曲线 -> 3.通过读取到的数据绘制相对湿度曲线 -> 4.通过读取到的数据绘制空气质量曲线 -> 5.通过读取到的数据绘制风向雷达图 -> 6.通过读取到的数据绘制温湿度相关性分析
这里使用了matplotlib库中的plt.plot()方法进行图形绘制
# data1_analysis.py
import matplotlib.pyplot as plt
import numpy as np
import pandas as pd
import math
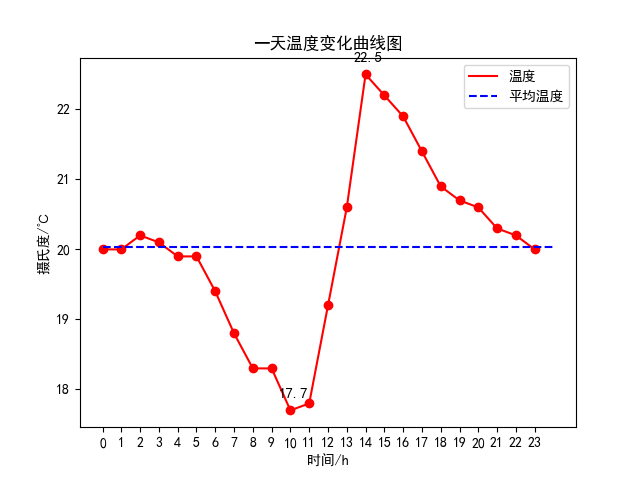
def tem_curve(data):
"""温度曲线绘制"""
hour = list(data['小时'])
tem = list(data['温度'])
for i in range(0, 24):
if math.isnan(tem[i]) == True:
tem[i] = tem[i - 1]
tem_ave = sum(tem) / 24 # 求平均温度
tem_max = max(tem)
tem_max_hour = hour[tem.index(tem_max)] # 求最高温度
tem_min = min(tem)
tem_min_hour = hour[tem.index(tem_min)] # 求最低温度
x = []
y = []
for i in range(0, 24):
x.append(i)
y.append(tem[hour.index(i)])
plt.figure(1)
plt.plot(x, y, color='red', label='温度') # 画出温度曲线
plt.scatter(x, y, color='red') # 点出每个时刻的温度点
plt.plot([0, 24], [tem_ave, tem_ave], c='blue', linestyle='--', label='平均温度') # 画出平均温度虚线
plt.text(tem_max_hour + 0.15, tem_max + 0.15, str(tem_max), ha='center', va='bottom', fontsize=10.5) # 标出最高温度
plt.text(tem_min_hour + 0.15, tem_min + 0.15, str(tem_min), ha='center', va='bottom', fontsize=10.5) # 标出最低温度
plt.xticks(x)
plt.legend()
plt.title('一天温度变化曲线图')
plt.xlabel('时间/h')
plt.ylabel('摄氏度/℃')
plt.show()
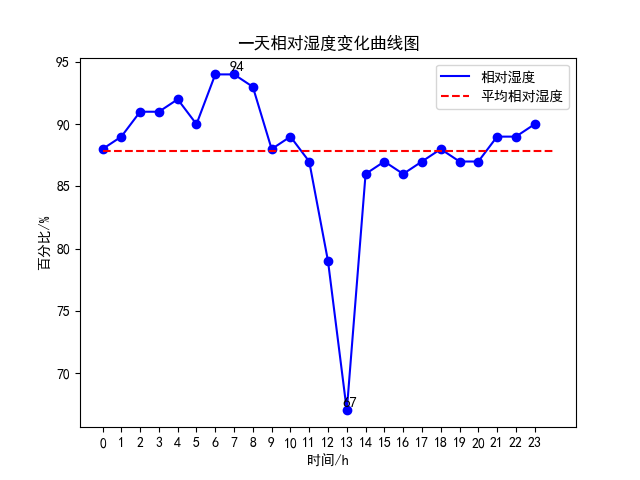
def hum_curve(data):
"""相对湿度曲线绘制"""
hour = list(data['小时'])
hum = list(data['相对湿度'])
for i in range(0, 24):
if math.isnan(hum[i]) == True:
hum[i] = hum[i - 1]
hum_ave = sum(hum) / 24 # 求平均相对湿度
hum_max = max(hum)
hum_max_hour = hour[hum.index(hum_max)] # 求最高相对湿度
hum_min = min(hum)
hum_min_hour = hour[hum.index(hum_min)] # 求最低相对湿度
x = []
y = []
for i in range(0, 24):
x.append(i)
y.append(hum[hour.index(i)])
plt.figure(2)
plt.plot(x, y, color='blue', label='相对湿度') # 画出相对湿度曲线
plt.scatter(x, y, color='blue') # 点出每个时刻的相对湿度
plt.plot([0, 24], [hum_ave, hum_ave], c='red', linestyle='--', label='平均相对湿度') # 画出平均相对湿度虚线
plt.text(hum_max_hour + 0.15, hum_max + 0.15, str(hum_max), ha='center', va='bottom', fontsize=10.5) # 标出最高相对湿度
plt.text(hum_min_hour + 0.15, hum_min + 0.15, str(hum_min), ha='center', va='bottom', fontsize=10.5) # 标出最低相对湿度
plt.xticks(x)
plt.legend()
plt.title('一天相对湿度变化曲线图')
plt.xlabel('时间/h')
plt.ylabel('百分比/%')
plt.show()
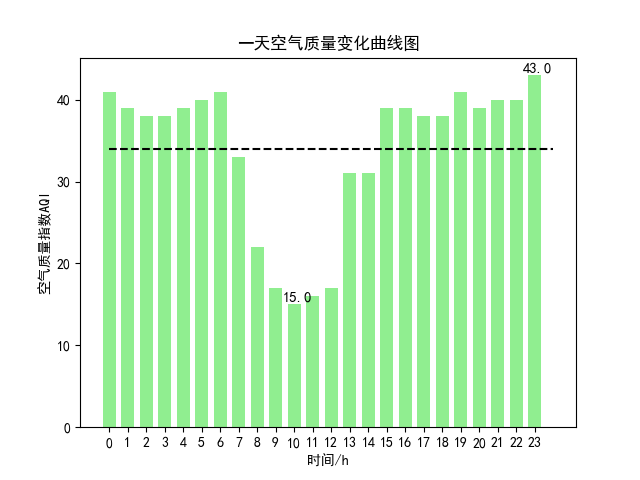
def air_curve(data):
"""空气质量曲线绘制"""
hour = list(data['小时'])
air = list(data['空气质量'])
print(type(air[0]))
for i in range(0, 24):
if math.isnan(air[i]) == True:
air[i] = air[i - 1]
air_ave = sum(air) / 24 # 求平均空气质量
air_max = max(air)
air_max_hour = hour[air.index(air_max)] # 求最高空气质量
air_min = min(air)
air_min_hour = hour[air.index(air_min)] # 求最低空气质量
x = []
y = []
for i in range(0, 24):
x.append(i)
y.append(air[hour.index(i)])
plt.figure(3)
for i in range(0, 24):
if y[i] <= 50:
plt.bar(x[i], y[i], color='lightgreen', width=0.7) # 1等级
elif y[i] <= 100:
plt.bar(x[i], y[i], color='wheat', width=0.7) # 2等级
elif y[i] <= 150:
plt.bar(x[i], y[i], color='orange', width=0.7) # 3等级
elif y[i] <= 200:
plt.bar(x[i], y[i], color='orangered', width=0.7) # 4等级
elif y[i] <= 300:
plt.bar(x[i], y[i], color='darkviolet', width=0.7) # 5等级
elif y[i] > 300:
plt.bar(x[i], y[i], color='maroon', width=0.7) # 6等级
plt.plot([0, 24], [air_ave, air_ave], c='black', linestyle='--') # 画出平均空气质量虚线
plt.text(air_max_hour + 0.15, air_max + 0.15, str(air_max), ha='center', va='bottom', fontsize=10.5) # 标出最高空气质量
plt.text(air_min_hour + 0.15, air_min + 0.15, str(air_min), ha='center', va='bottom', fontsize=10.5) # 标出最低空气质量
plt.xticks(x)
plt.title('一天空气质量变化曲线图')
plt.xlabel('时间/h')
plt.ylabel('空气质量指数AQI')
plt.show()
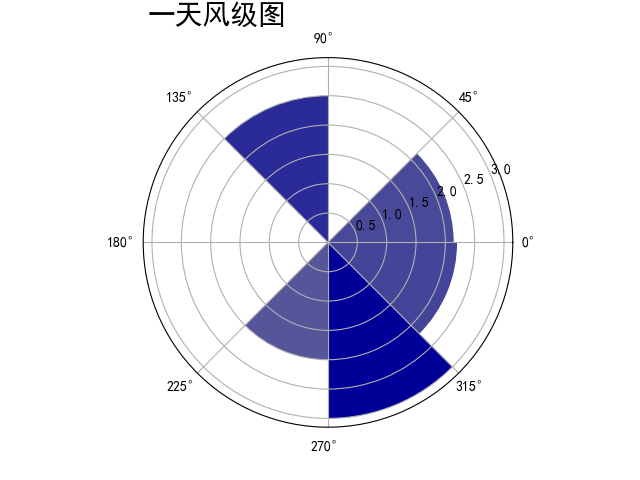
def wind_radar(data):
"""风向雷达图"""
wind = list(data['风力方向'])
wind_speed = list(data['风级'])
for i in range(0, 24):
if wind[i] == "北风":
wind[i] = 90
elif wind[i] == "南风":
wind[i] = 270
elif wind[i] == "西风":
wind[i] = 180
elif wind[i] == "东风":
wind[i] = 360
elif wind[i] == "东北风":
wind[i] = 45
elif wind[i] == "西北风":
wind[i] = 135
elif wind[i] == "西南风":
wind[i] = 225
elif wind[i] == "东南风":
wind[i] = 315
degs = np.arange(45, 361, 45)
temp = []
for deg in degs:
speed = []
# 获取 wind_deg 在指定范围的风速平均值数据
for i in range(0, 24):
if wind[i] == deg:
speed.append(wind_speed[i])
if len(speed) == 0:
temp.append(0)
else:
temp.append(sum(speed) / len(speed))
print(temp)
N = 8
theta = np.arange(0. + np.pi / 8, 2 * np.pi + np.pi / 8, 2 * np.pi / 8)
# 数据极径
radii = np.array(temp)
# 绘制极区图坐标系
plt.axes(polar=True)
# 定义每个扇区的RGB值(R,G,B),x越大,对应的颜色越接近蓝色
colors = [(1 - x / max(temp), 1 - x / max(temp), 0.6) for x in radii]
plt.bar(theta, radii, width=(2 * np.pi / N), bottom=0.0, color=colors)
plt.title('一天风级图', x=0.2, fontsize=20)
plt.show()
def calc_corr(a, b):
"""计算相关系数"""
a_avg = sum(a) / len(a)
b_avg = sum(b) / len(b)
cov_ab = sum([(x - a_avg) * (y - b_avg) for x, y in zip(a, b)])
sq = math.sqrt(sum([(x - a_avg) ** 2 for x in a]) * sum([(x - b_avg) ** 2 for x in b]))
corr_factor = cov_ab / sq
return corr_factor
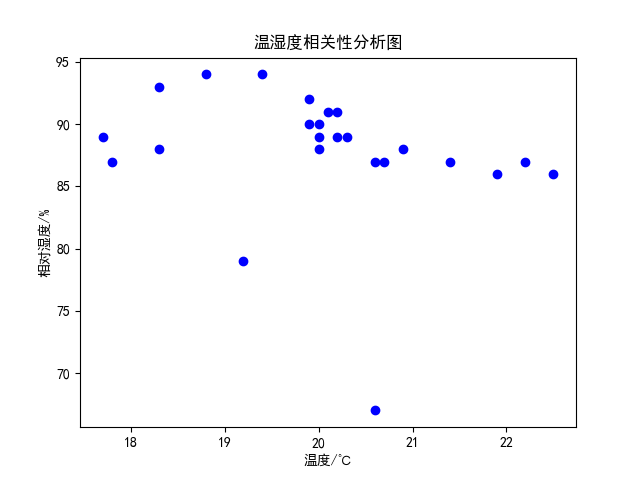
def corr_tem_hum(data):
"""温湿度相关性分析"""
tem = data['温度']
hum = data['相对湿度']
plt.scatter(tem, hum, color='blue')
plt.title("温湿度相关性分析图")
plt.xlabel("温度/℃")
plt.ylabel("相对湿度/%")
plt.text(20, 40, "相关系数为:" + str(calc_corr(tem, hum)), fontsize=10, color='red')
plt.show()
print("相关系数为:" + str(calc_corr(tem, hum)))
def main():
plt.rcParams['font.sans-serif'] = ['SimHei'] # 解决中文显示问题
plt.rcParams['axes.unicode_minus'] = False # 解决负号显示问题
data1 = pd.read_csv('weather1.csv', encoding='gb2312')
print(data1)
tem_curve(data1)
hum_curve(data1)
air_curve(data1)
wind_radar(data1)
corr_tem_hum(data1)
if __name__ == '__main__':
main()第三部分:
data14_analysis.py (14天天气图形绘制)
和上面当天天气图形绘制一样,先读取csv中的天气数据,然后绘制温度曲线、风向雷达图、天气饼图
# data14_analysis.py
import matplotlib.pyplot as plt
import numpy as np
import pandas as pd
import math
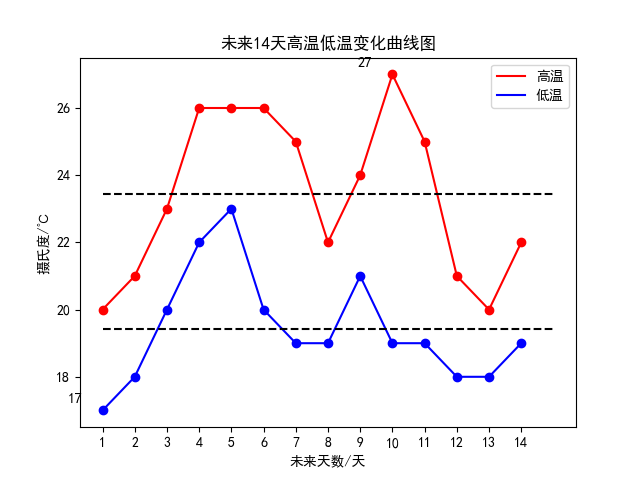
def tem_curve(data):
"""温度曲线绘制"""
date = list(data['日期'])
tem_low = list(data['最低气温'])
tem_high = list(data['最高气温'])
for i in range(0, 14):
if math.isnan(tem_low[i]) == True:
tem_low[i] = tem_low[i - 1]
if math.isnan(tem_high[i]) == True:
tem_high[i] = tem_high[i - 1]
tem_high_ave = sum(tem_high) / 14 # 求平均高温
tem_low_ave = sum(tem_low) / 14 # 求平均低温
tem_max = max(tem_high)
tem_max_date = tem_high.index(tem_max) # 求最高温度
tem_min = min(tem_low)
tem_min_date = tem_low.index(tem_min) # 求最低温度
x = range(1, 15)
plt.figure(1)
plt.plot(x, tem_high, color='red', label='高温') # 画出高温度曲线
plt.scatter(x, tem_high, color='red') # 点出每个时刻的温度点
plt.plot(x, tem_low, color='blue', label='低温') # 画出低温度曲线
plt.scatter(x, tem_low, color='blue') # 点出每个时刻的温度点
plt.plot([1, 15], [tem_high_ave, tem_high_ave], c='black', linestyle='--') # 画出平均温度虚线
plt.plot([1, 15], [tem_low_ave, tem_low_ave], c='black', linestyle='--') # 画出平均温度虚线
plt.legend()
plt.text(tem_max_date + 0.15, tem_max + 0.15, str(tem_max), ha='center', va='bottom', fontsize=10.5) # 标出最高温度
plt.text(tem_min_date + 0.15, tem_min + 0.15, str(tem_min), ha='center', va='bottom', fontsize=10.5) # 标出最低温度
plt.xticks(x)
plt.title('未来14天高温低温变化曲线图')
plt.xlabel('未来天数/天')
plt.ylabel('摄氏度/℃')
plt.show()
def change_wind(wind):
"""改变风向"""
for i in range(0, 14):
if wind[i] == "北风":
wind[i] = 90
elif wind[i] == "南风":
wind[i] = 270
elif wind[i] == "西风":
wind[i] = 180
elif wind[i] == "东风":
wind[i] = 360
elif wind[i] == "东北风":
wind[i] = 45
elif wind[i] == "西北风":
wind[i] = 135
elif wind[i] == "西南风":
wind[i] = 225
elif wind[i] == "东南风":
wind[i] = 315
return wind
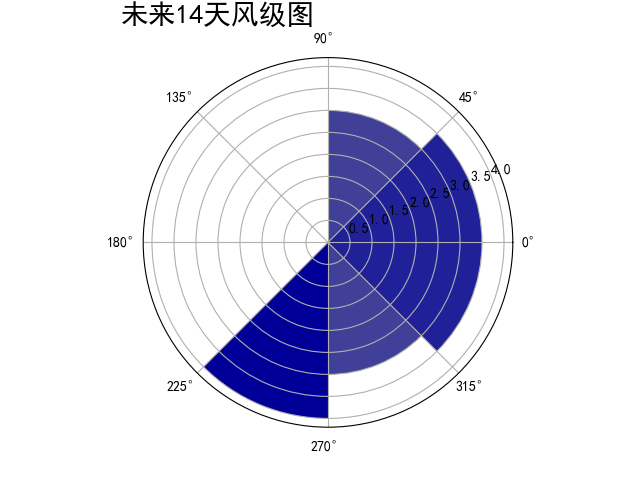
def wind_radar(data):
"""风向雷达图"""
wind1 = list(data['风向1'])
wind2 = list(data['风向2'])
wind_speed = list(data['风级'])
wind1 = change_wind(wind1)
wind2 = change_wind(wind2)
degs = np.arange(45, 361, 45)
temp = []
for deg in degs:
speed = []
# 获取 wind_deg 在指定范围的风速平均值数据
for i in range(0, 14):
if wind1[i] == deg:
speed.append(wind_speed[i])
if wind2[i] == deg:
speed.append(wind_speed[i])
if len(speed) == 0:
temp.append(0)
else:
temp.append(sum(speed) / len(speed))
print(temp)
N = 8
theta = np.arange(0. + np.pi / 8, 2 * np.pi + np.pi / 8, 2 * np.pi / 8)
# 数据极径
radii = np.array(temp)
# 绘制极区图坐标系
plt.axes(polar=True)
# 定义每个扇区的RGB值(R,G,B),x越大,对应的颜色越接近蓝色
colors = [(1 - x / max(temp), 1 - x / max(temp), 0.6) for x in radii]
plt.bar(theta, radii, width=(2 * np.pi / N), bottom=0.0, color=colors)
plt.title('未来14天风级图', x=0.2, fontsize=20)
plt.show()
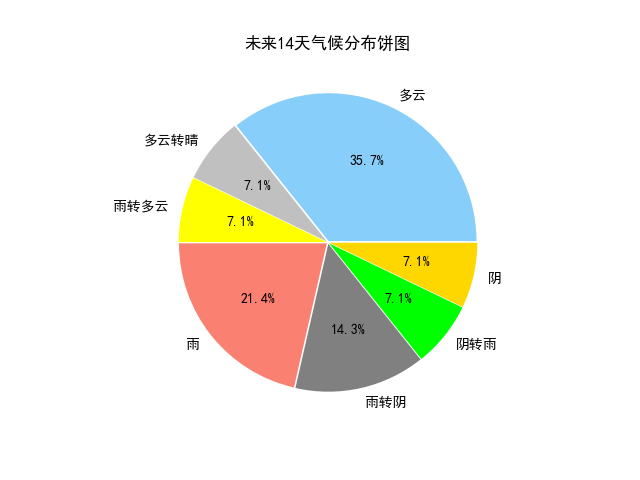
def weather_pie(data):
"""绘制天气饼图"""
weather = list(data['天气'])
dic_wea = {}
for i in range(0, 14):
if weather[i] in dic_wea.keys():
dic_wea[weather[i]] += 1
else:
dic_wea[weather[i]] = 1
print(dic_wea)
explode = [0.01] * len(dic_wea.keys())
color = ['lightskyblue', 'silver', 'yellow', 'salmon', 'grey', 'lime', 'gold', 'red', 'green', 'pink']
plt.pie(dic_wea.values(), explode=explode, labels=dic_wea.keys(), autopct='%1.1f%%', colors=color)
plt.title('未来14天气候分布饼图')
plt.show()
def main():
plt.rcParams['font.sans-serif'] = ['SimHei'] # 解决中文显示问题
plt.rcParams['axes.unicode_minus'] = False # 解决负号显示问题
data14 = pd.read_csv('weather14.csv', encoding='gb2312')
print(data14)
tem_curve(data14)
wind_radar(data14)
weather_pie(data14)
if __name__ == '__main__':
main()
获取的结果分析图:
一天天气图形绘制
14天天气图形绘制: